How to Analyze Customer Feedback for FREE?
Use the Google Sheet formula or the free tool for quantitative (NPS, CSAT) and qualitative customer feedback analysis.

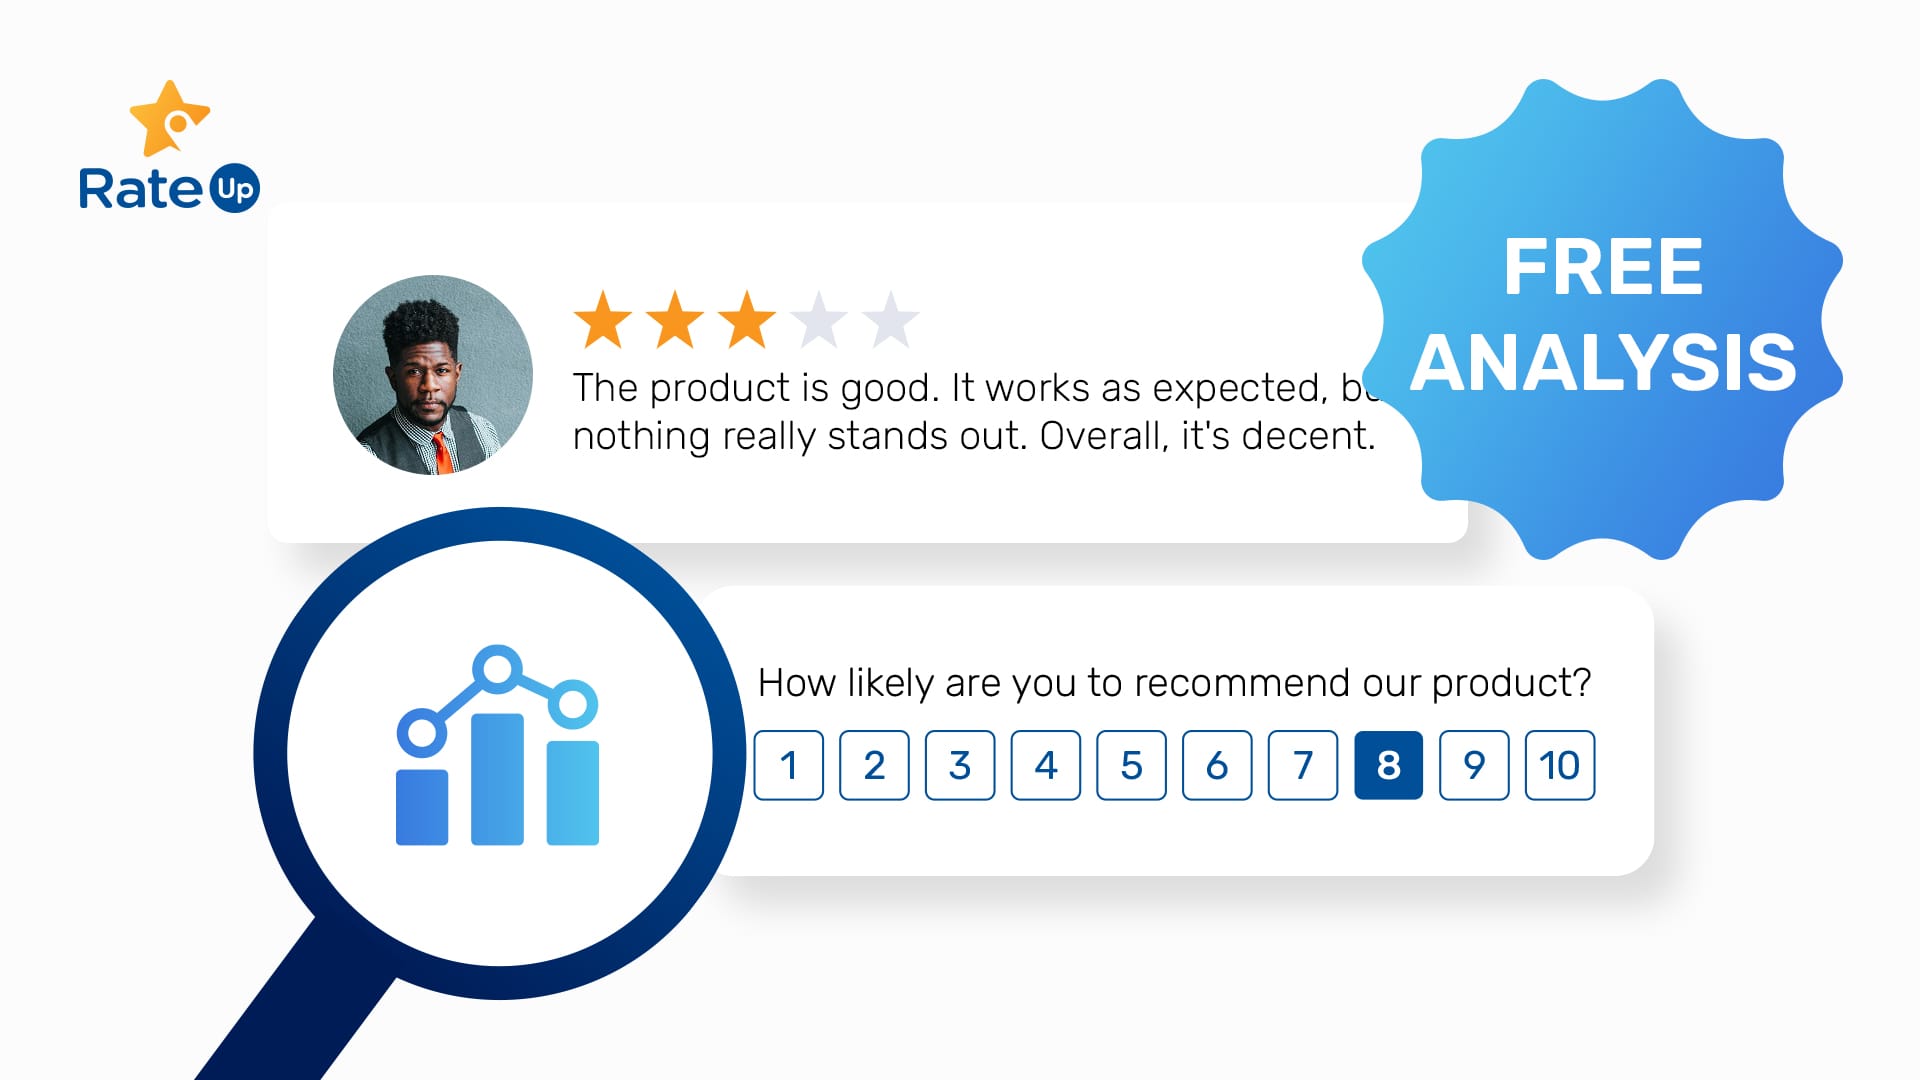
I’ve seen SMB founders and operation managers mostly use Google Forms to collect customer feedback. It’s free, easy to use, and neatly organizes responses in a spreadsheet.
But here's the million-dollar question: once you've gathered all that valuable feedback, how do you actually make sense of it?
Making sense of customer feedback isn't just about reading through responses. It's about uncovering key insights that can drive your business forward:
- Are your customers truly satisfied with their experience?
- How likely are they to recommend your product or service to others?
- Which aspects of your offering do they love, and which could use improvement?
These are the questions that proper customer feedback analysis can answer.
Here, I’ll share two feedback analysis methods: manual and automatic. Both are free.
Manual customer feedback analysis
I assume you’ve used Google Forms to collect feedback. And your feedback data in the Google Sheet includes numbers (quantitative) and words (qualitative).
Quantitative analysis
For example, let’s say you’d asked the following questions in the feedback form:
- On a scale from 0 to 10, how likely are you to recommend our software/product to a friend or colleague?
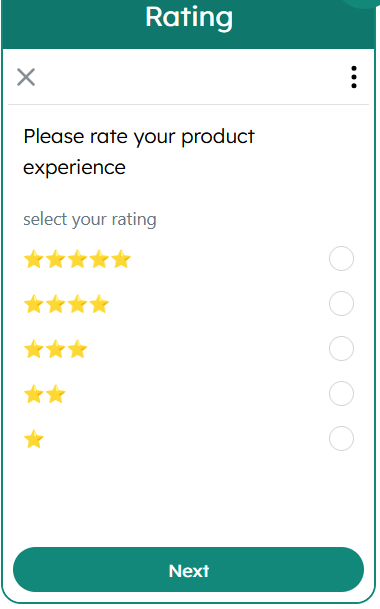
- On a scale from 1 to 5, how satisfied are you with the product/service/experience?
- What do you like most about the product/experience?
- What improvements would you suggest?
The first two questions are NPS and CSAT, respectively. You get a particular rating (quantitative) for the questions.
The remaining two will collect text inputs (qualitative) from the customer.
Let’s see how to analyze them.
How to calculate NPS
NPS helps you understand customer loyalty. You can calculate NPS using the following formula:
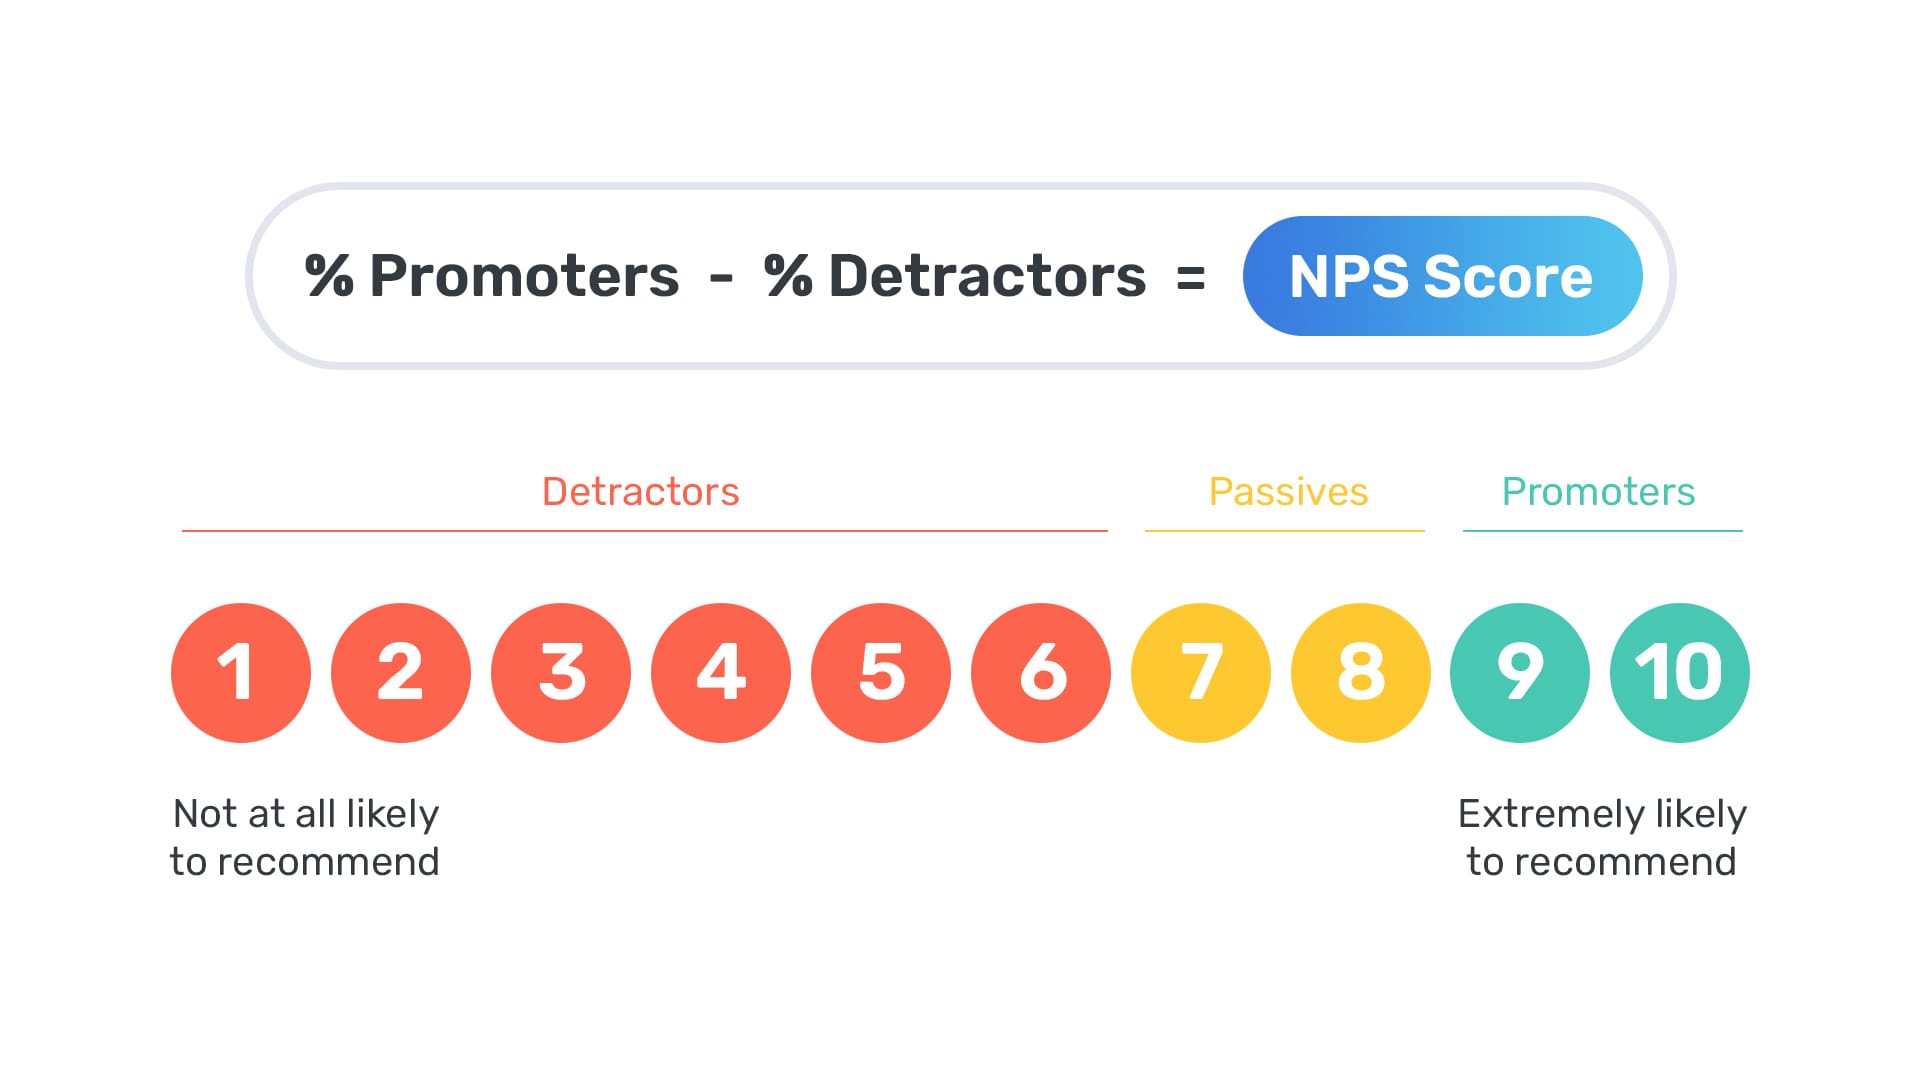
Customers who gave you ratings from 0-6 are detractors, 7-8 passives, and 9-10 promoters.
First, calculate the percentage of promoters and detractors.
Enter the following formula in a new cell in your Google Sheet to get promoter %:
=COUNTIF(B2:B11, ">=9") / COUNTA(B2:B11) * 100
B2 and B11 are the first and last cells with an NPS score, respectively. Based on your data, you should change the cell names.
Then, calculate the detractor % on a different cell using the formula below:
=COUNTIF(B2:B11, "<=6") / COUNTA(B2:B11) * 100
Now, simply subtract detractor % from promoter % to calculate NPS.
You can compare it with the average NPS benchmark for your industry to understand if you have a healthy score.
However, as a rule, businesses should avoid a negative NPS (more detractors than promoters) and ensure that NPS data shows a positive trend over time.
How to calculate CSAT
Customer satisfaction (CSAT) score tells you how happy customers are with a recent purchase or interaction with your business.
Calculating CSAT is comparatively simpler — add all your scores and divide it by the number of responses.
You can use the following formula on Google Sheets to calculate CSAT:
=AVERAGE(C2:C11)
Note that you should change the cell name to the first and last cell names in your sheets accordingly. An overall score of 4+ out of 5 is an excellent CSAT score.
Qualitative analysis
The third (Q3: What do you like most about the product/experience?) and fourth (Q4: What improvements would you suggest?) questions are comparatively time-consuming to analyze. But it’s well worth it.
Try these steps to analyze such open-ended questions:
- Identify critical themes: For Q3, you might see a common theme, such as “Excellent customer support,” “Clean UI,” or “Great features.” For Q4, they can be “Fix bugs,” “Improve UI,” or “Add more features.”
- Count occurrences: Sift through the responses and note how often the common themes occur. Alternatively, you can create a word cloud from the responses.
- Summarize the findings: For example, the most common positive feedback can be the clean UI. Similarly, the most common suggestion can be bug fixing. Now, you have prioritized items based on how common they are among customers, ready to be reported to respective departments for further action.
It’s actually the above open-ended (qualitative) questions that give you insights into why customers gave you specific ratings.
The questions help you understand what attracts them to your business and what needs improvement.
Automatically analyze customer feedback
Customer satisfaction surveys aren't just one-time events; they're often part of an ongoing process to track how customers' perceptions evolve over time.
However, as you shift towards continuous evaluation, manually analyzing feedback can quickly become overwhelming:
- The analysis process can stretch into days or even weeks
- Delays in closing the customer feedback loop can slow down the implementation of recommended changes
- You might find yourself needing to hire dedicated staff just to manage the customer feedback process
The good news is that these issues can be solved by automating the customer feedback process.
You can adopt a customer feedback management platform like RateUp that doesn’t strain your budget like enterprise solutions.
But before we see the automatic feedback analysis method, note that it can’t import historical data. That means you will have to analyze the data on Google Sheets manually.
On the flip side, instead of seeing this as a limitation, view it as an opportunity to start fresh with a more targeted, relevant feedback collection and analysis process.
Create a free survey on RateUp and automatically analyze responses
For this, all you need is a valid email address. You don’t have to give any payment details.
Here’s how it works:
- Create your feedback form: Sign up and set up a free, customized feedback form on RateUp using the form builder.
- Share the survey: Share your newly created feedback form as a link or customizable, on-brand QR code with customers through your preferred channels.
- Monitor responses in real-time: As feedback starts rolling in, you'll see responses populate your dashboard instantly.
- Gain instant insights: RateUp automatically calculates and visualizes key metrics like NPS and CSAT, giving you immediate insights into customer sentiment.
- Share actionable reports: Download the reports and share them with executives and team members to keep them informed.
If these steps seem overwhelming or complicated to imagine, feel free to watch the video below (it’s dead simple, actually):
How to create FREE customer satisfaction surveys and analyze responses?
Creating your account using just your email ID allows you to send two surveys and analyze 100 responses per month.
Besides, you can configure WhatsApp Flows (interactive, WhatsApp-native feedback forms) on the platform to receive and analyze another 100 monthly responses for free.
(Of course, enrolling on a pricing plan allows you to create and track tickets, direct only satisfied users to your Google Review page, and more. Check out the pricing page for more details.)
Automating customer feedback management has a positive ROI
It doesn’t cost much to automate customer feedback management and analysis using the RateUp platform. Even a single feedback acted upon can significantly grow your bottom line, giving the investment 10x ROI.
But you don’t have to take my word for it. I’m saying this based on the math I’d done before (link below).
Please feel free to do one on your own (or get in touch if you need any help).
I hope this helps when you’re on it: https://blog.rateup.app/automate-customer-feedback-roi/.